Connect equipment metadata, booking activity, and structured reporting so you can see what’s being used, what isn’t, and what’s worth investing in.
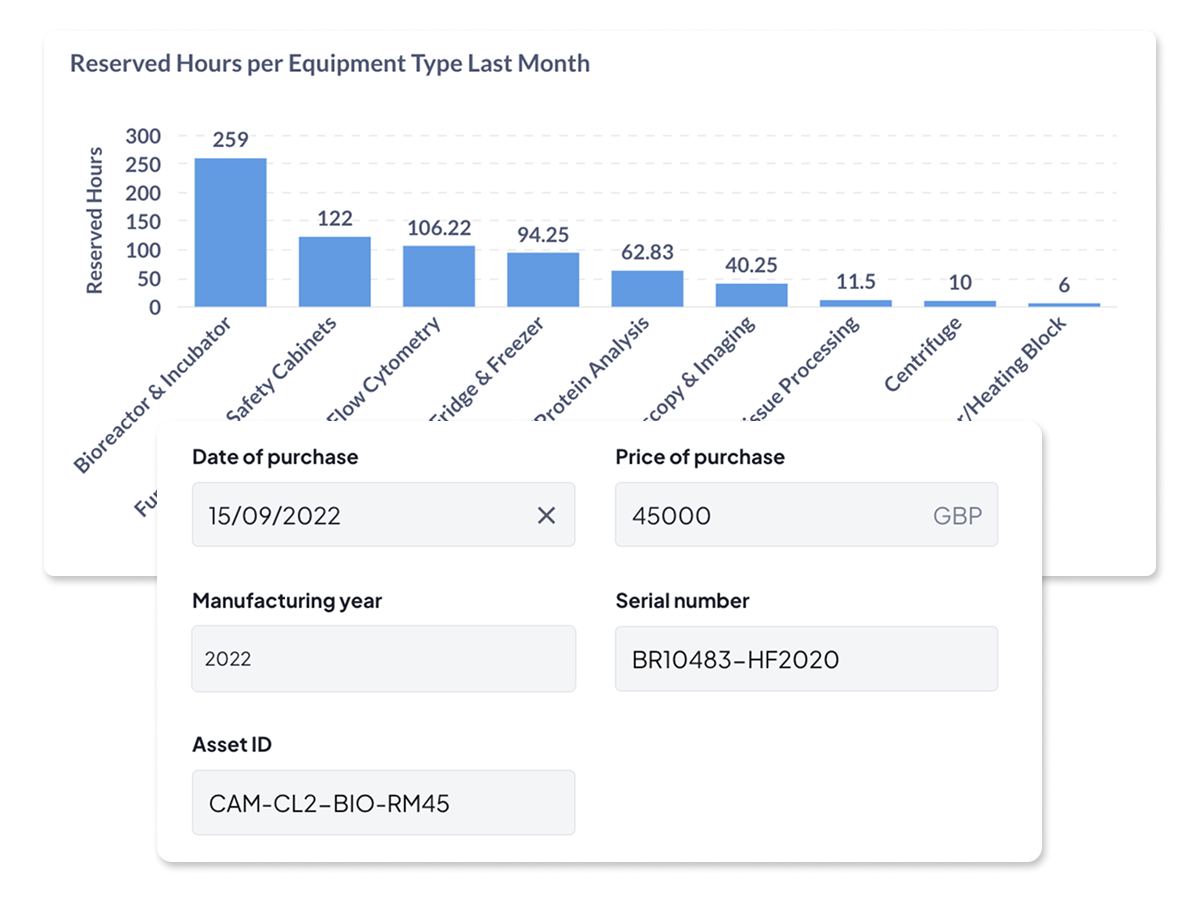
Maintain a searchable equipment directory with tags, purchase info, and access metadata. Avoid duplicate purchases and create a true source of truth for your fleet.

Privately track purchase price and date per asset. Link cost to usage over time and inform depreciation and replacement planning.

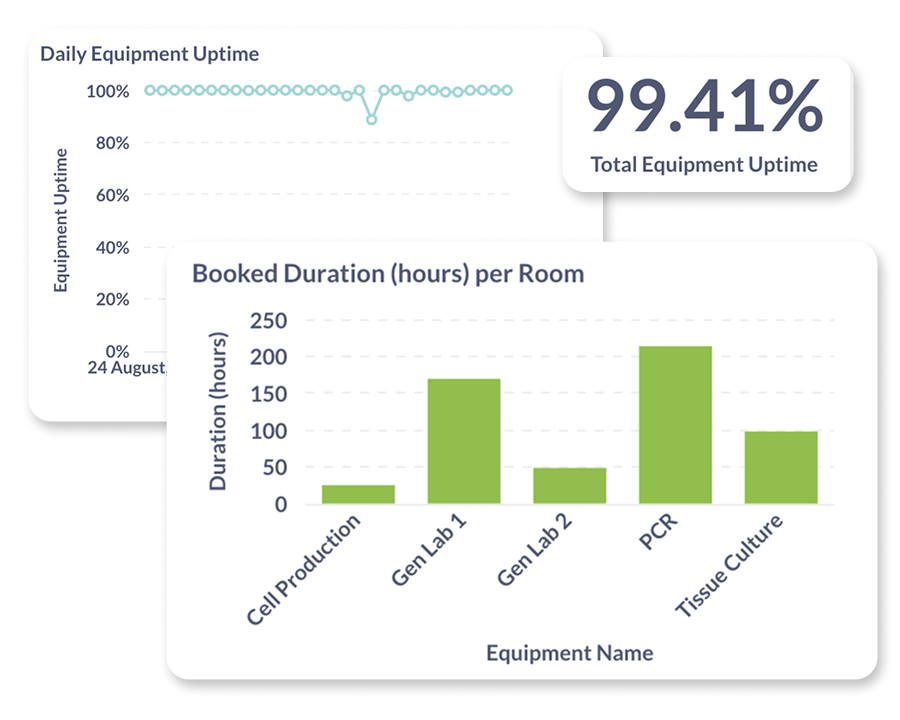
Export usage data by instrument, project, user, or timeframe. Include booking notes, costs, and context. Configure fields to match your internal templates and workflows.

Replace spreadsheets and uncertainty with a searchable, manageable directory of all your R&D equipment.

An easy, visual way to book equipment that keeps track of availability, reduces conflicts, and helps teams plan their work.

Make confident decisions with clean usage data so you can see what's being used, what isn't, where, and why.

Schedule and block off equipment for maintenance and calibration, assign tasks to contractors, and keep everyone in the loop.

Assign roles, invite new users, enforce training rules, and scale user access without losing oversight.
Keep everyone aligned and on time with booking reminders, maintenance alerts, calendar sync, and lab-wide announcements.


“We get an extremely granular view of how every piece of equipment is being used down to the exact minute.”


“Without it, we probably would have bought more kit than we really needed. Calira gave us the visibility to see where we could share or reallocate instead.”

“The most valuable aspect is the visibility among the users—knowing what’s available to book. From a LabOps perspective, it’s become our record management system for servicing, embedded into our SOPs.”


“Calira helped us improve our equipment usage and planning processes within our teams. It's also handy for me to have oversight of the utilization of our instruments.”


"Calira has improved the process of booking laboratory equipment in our R&D teams, created visibility across teams, improved insight into real time equipment status and allowed us to gather data for equipment usage with ease.”

"I haven't needed to log in in the last two weeks to sort anything out. Scheduling runs quite a lot smoother now."


Calira combines three data sources used in most CapEx decisions: a full asset inventory per lab, purchase price and purchase date metadata per instrument, and utilisation reports showing how often each piece of equipment is actually booked and used. Together they give finance and lab ops the evidence to justify new purchases, defer others, or reallocate existing kit.
Yes. Each equipment record can hold purchase price, date of purchase, manufacturing year, serial number, and an asset ID. This means depreciation, replacement timing, and cost-per-hour calculations can be generated with data directly from Calira.
Yes. Utilisation reports aggregate by equipment, group, lab, or project. So, before approving a new purchase request, you can check whether similar instruments elsewhere in the organisation are underused and could be shared or reallocated. Customers frequently cite this as a way to avoid duplicate purchases.
Yes. Reports download as CSV and can be aggregated by equipment, user, group, project, or funding code, then filtered by date range, status, or instrument. That makes it straightforward to slice the data to match internal finance or CapEx templates in Excel or BI tools.
Yes. Calira supports multi-lab setups with centralised reporting, so you can aggregate utilisation and asset data across locations. This is particularly useful for larger organisations building group-wide CapEx cases or rationalising equipment fleets across multiple R&D sites.

We know that every lab is different. Our team has years of experience in the lab and can answer any question you have and demo the whole platform in less than thirty minutes.