Understand equipment usage, maintenance, and downtime with data exports and AI-based analysis. Support reporting across ops, compliance, and finance.
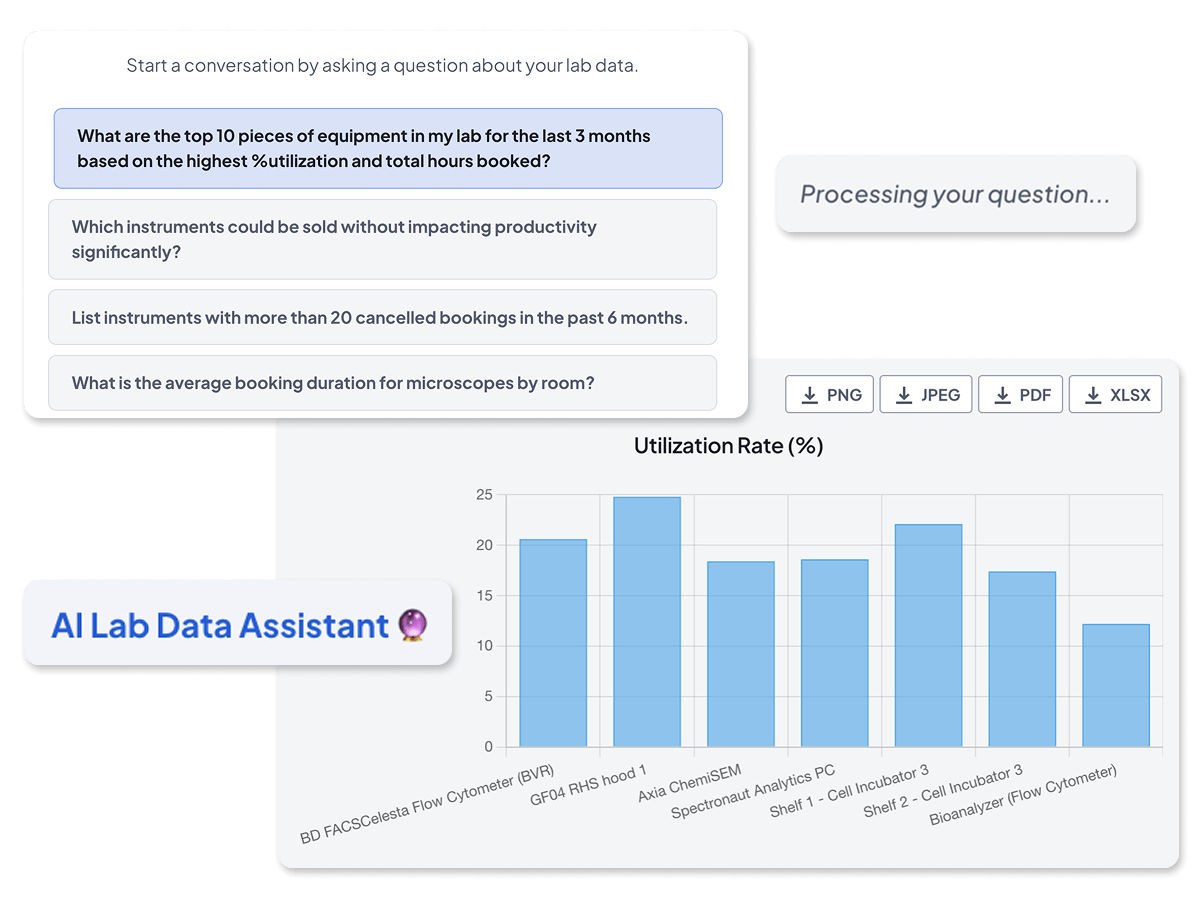
No time to download reports and run analysis yourself? Chat with our AI tool to get what you need in the moment. (Available on request.)
Download structured usage data for any lab, project, instrument, or time window. No more chasing spreadsheets or digging through raw logs and shared calendars.
Define the data you need for budgeting and procurement, internal reporting, or executive updates, over any timeframe.
Use our API to connect lab booking data to internal reporting tools, or work with us to build a custom BI layer.
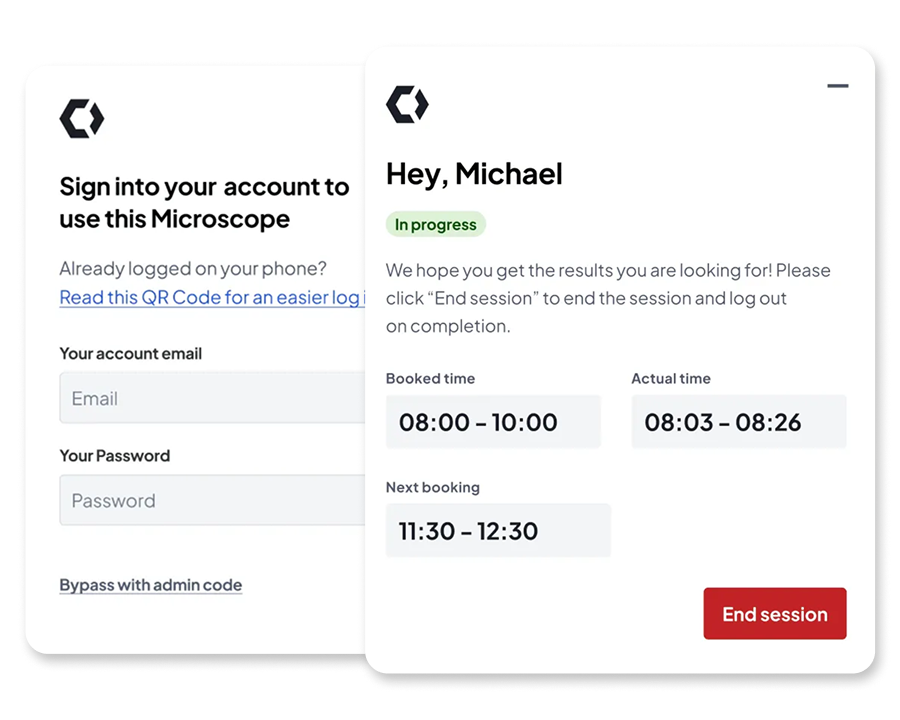
LabTrack™ installs onto equipment-connected PCs, measuring real-time usage and, where needed, limiting access entirely unless users have bookings and the correct access rights.



Build a structured, searchable directory of your lab equipment and enrich it with metadata, location information, and purchase price.

Make availability clear to lab users, let teams book shared instruments with confidence, and avoid double bookings.

Give your team the visibility and control to reduce idle time and maximise usage across shared equipment.

Prevent downtime through visible maintenance tracking, safer access, and smarter user controls.

Make confident decisions with clean usage data so you can see what's being used, what isn't, where, and why.

Turn lab usage data into a structured foundation: exportable, filterable, and ready for integration with your ELN, AI, or BI platforms.


“We get an extremely granular view of how every piece of equipment is being used down to the exact minute.”


“Without it, we probably would have bought more kit than we really needed. Calira gave us the visibility to see where we could share or reallocate instead.”

“The most valuable aspect is the visibility among the users—knowing what’s available to book. From a LabOps perspective, it’s become our record management system for servicing, embedded into our SOPs.”


“Calira helped us improve our equipment usage and planning processes within our teams. It's also handy for me to have oversight of the utilization of our instruments.”


"Calira has improved the process of booking laboratory equipment in our R&D teams, created visibility across teams, improved insight into real time equipment status and allowed us to gather data for equipment usage with ease.”


"I haven't needed to log in in the last two weeks to sort anything out. Scheduling runs quite a lot smoother now."


Every booking generates structured usage data against instruments, users, groups, and projects. Reports are built in the platform, filtered by the dimensions you need, and exported as CSV for use in finance, procurement, compliance, or executive updates.
Reports can be aggregated by user, lab, equipment, equipment and user, group, or project. You can also filter by booking status, date range, or specific instruments; useful when you want a report of, for example, only completed bookings on a single instrument over a quarter.
Yes. All reports download as CSV, which you can open directly in Excel or pipe into BI tools like Power BI, Tableau, or Looker. Enterprise customers can also use the Calira API to connect live booking data to internal reporting dashboards.
Booking data shows what users reserved; LabTrack data shows what actually happened at the instrument. In Reports, select 'Equipment bookings' to see reserved time, or 'LabTrack (no booking required)' to see walk-up sessions.
Reports are available on Premium and Enterprise subscriptions. Core (academic) includes the platform but not the full reporting suite.


We know that every lab is different. Our team has years of experience in the lab and can answer any question you have and demo the whole platform in less than thirty minutes.