
Get rich reporting data about lab equipment usage, and get an angle on where your bottlenecks are (and aren't).

Keep track of which lab users used what equipment, where, when, and for how long.

Use our AI tool to get image, PDF, or XLSX charts and reports on your lab data with rapid back-and-forth chat.
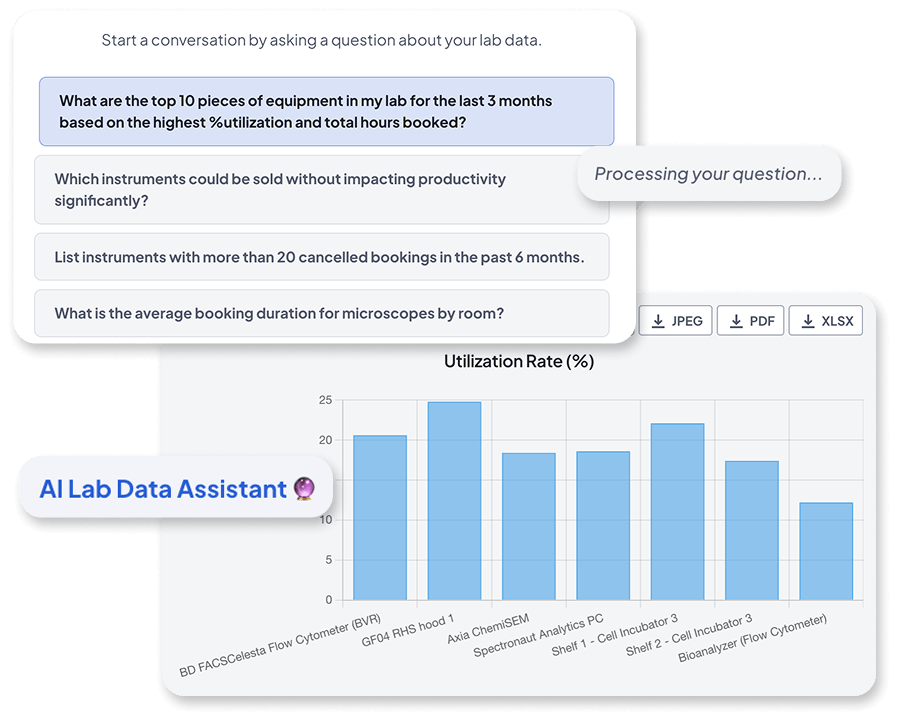
LabTrack™ desktop client installs onto local instrument-connected PCs to monitor real-time use and report precise usage data back to the system. Where needed, it can also block equipment use unless a booking exists.

Generate exportable data to support finance, maintenance, or CapEx planning discussions.



Replace spreadsheets and uncertainty with a searchable, manageable directory of all your R&D equipment.

An easy, visual way to book equipment that keeps track of availability, reduces conflicts, and helps teams plan their work.

Make confident decisions with clean usage data so you can see what's being used, what isn't, where, and why.

Schedule and block off equipment for maintenance and calibration, assign tasks to contractors, and keep everyone in the loop.

Assign roles, invite new users, enforce training rules, and scale user access without losing oversight.
Keep everyone aligned and on time with booking reminders, maintenance alerts, calendar sync, and lab-wide announcements.


“We get an extremely granular view of how every piece of equipment is being used down to the exact minute.”


“Without it, we probably would have bought more kit than we really needed. Calira gave us the visibility to see where we could share or reallocate instead.”

“The most valuable aspect is the visibility among the users—knowing what’s available to book. From a LabOps perspective, it’s become our record management system for servicing, embedded into our SOPs.”


“Calira helped us improve our equipment usage and planning processes within our teams. It's also handy for me to have oversight of the utilization of our instruments.”


"Calira has improved the process of booking laboratory equipment in our R&D teams, created visibility across teams, improved insight into real time equipment status and allowed us to gather data for equipment usage with ease.”


"I haven't needed to log in in the last two weeks to sort anything out. Scheduling runs quite a lot smoother now."


Every booking made in Calira generates utilisation data against the instrument, user, group, or project. Admins can see how many bookings an instrument receives, total hours reserved, and which users use it—all exportable as reports. For instruments connected to a PC, LabTrack also captures the actual login and logout times.
Yes. Reports can be aggregated by equipment, equipment and user, group, lab, project, or funding code, so you can identify instruments that are heavily booked (candidates for additional capacity) and instruments that sit idle (candidates for reallocation, sharing, or removal from the portfolio). Many customers use this to inform purchasing and CapEx discussions.
Booked time is what the user reserved; actual time is what LabTrack logs when they sign in and out of the instrument PC. Reports include 'Actual Start Time', 'Actual End Time' and 'Actual Duration' columns, so you can compare both; common way to identify over-booking, abandoned sessions, or instruments that users hold longer than they need.
Yes. Reports can be aggregated by user, lab, equipment, group, or project, and you can filter results down further. For example, all bookings on a specific instrument, all completed bookings only, or all usage against a particular funding code. Output is CSV, so you can slice further in Excel or BI tools.
Yes. Calira supports multi-lab setups with centralised oversight. You can aggregate utilisation data by lab, compare sites, and roll results up for enterprise reporting; useful for organisations running shared equipment across several R&D locations.

We know that every lab is different. Our team has years of experience in the lab and can answer any question you have and demo the whole platform in less than thirty minutes.