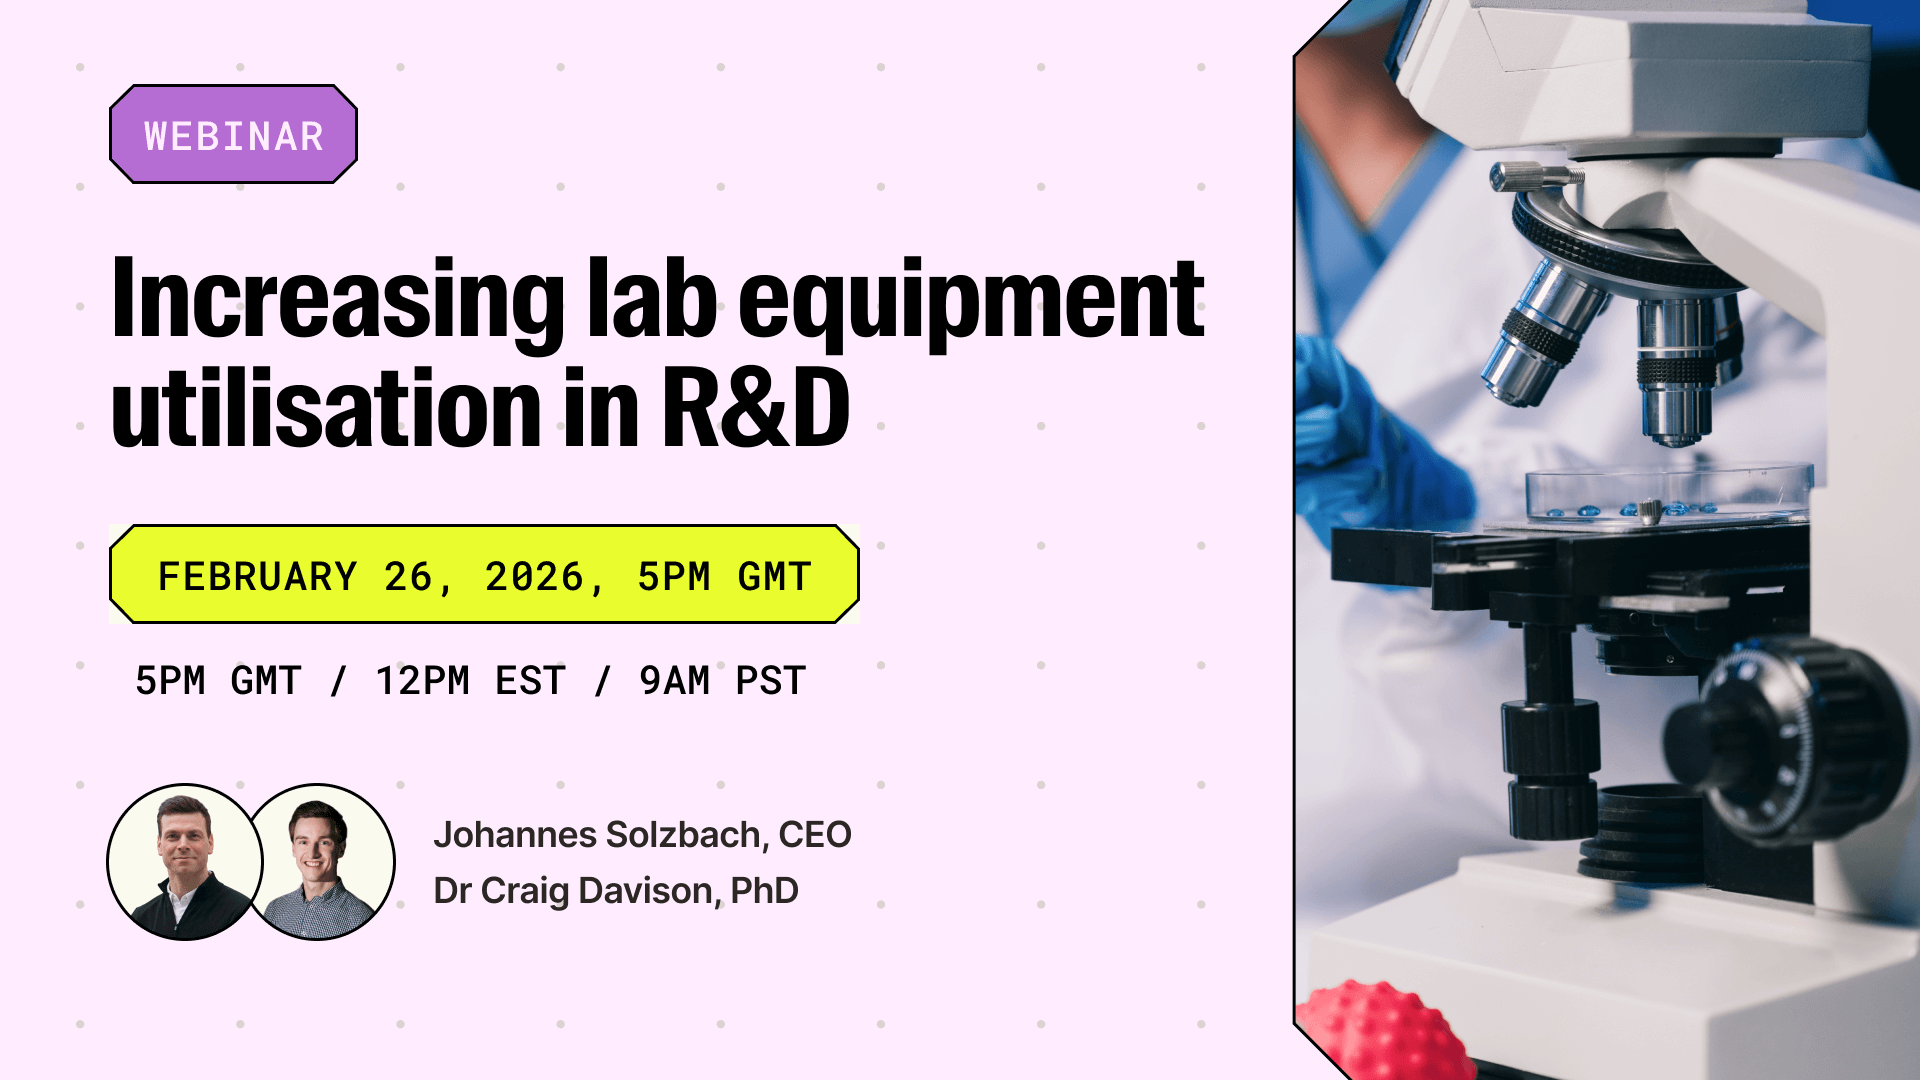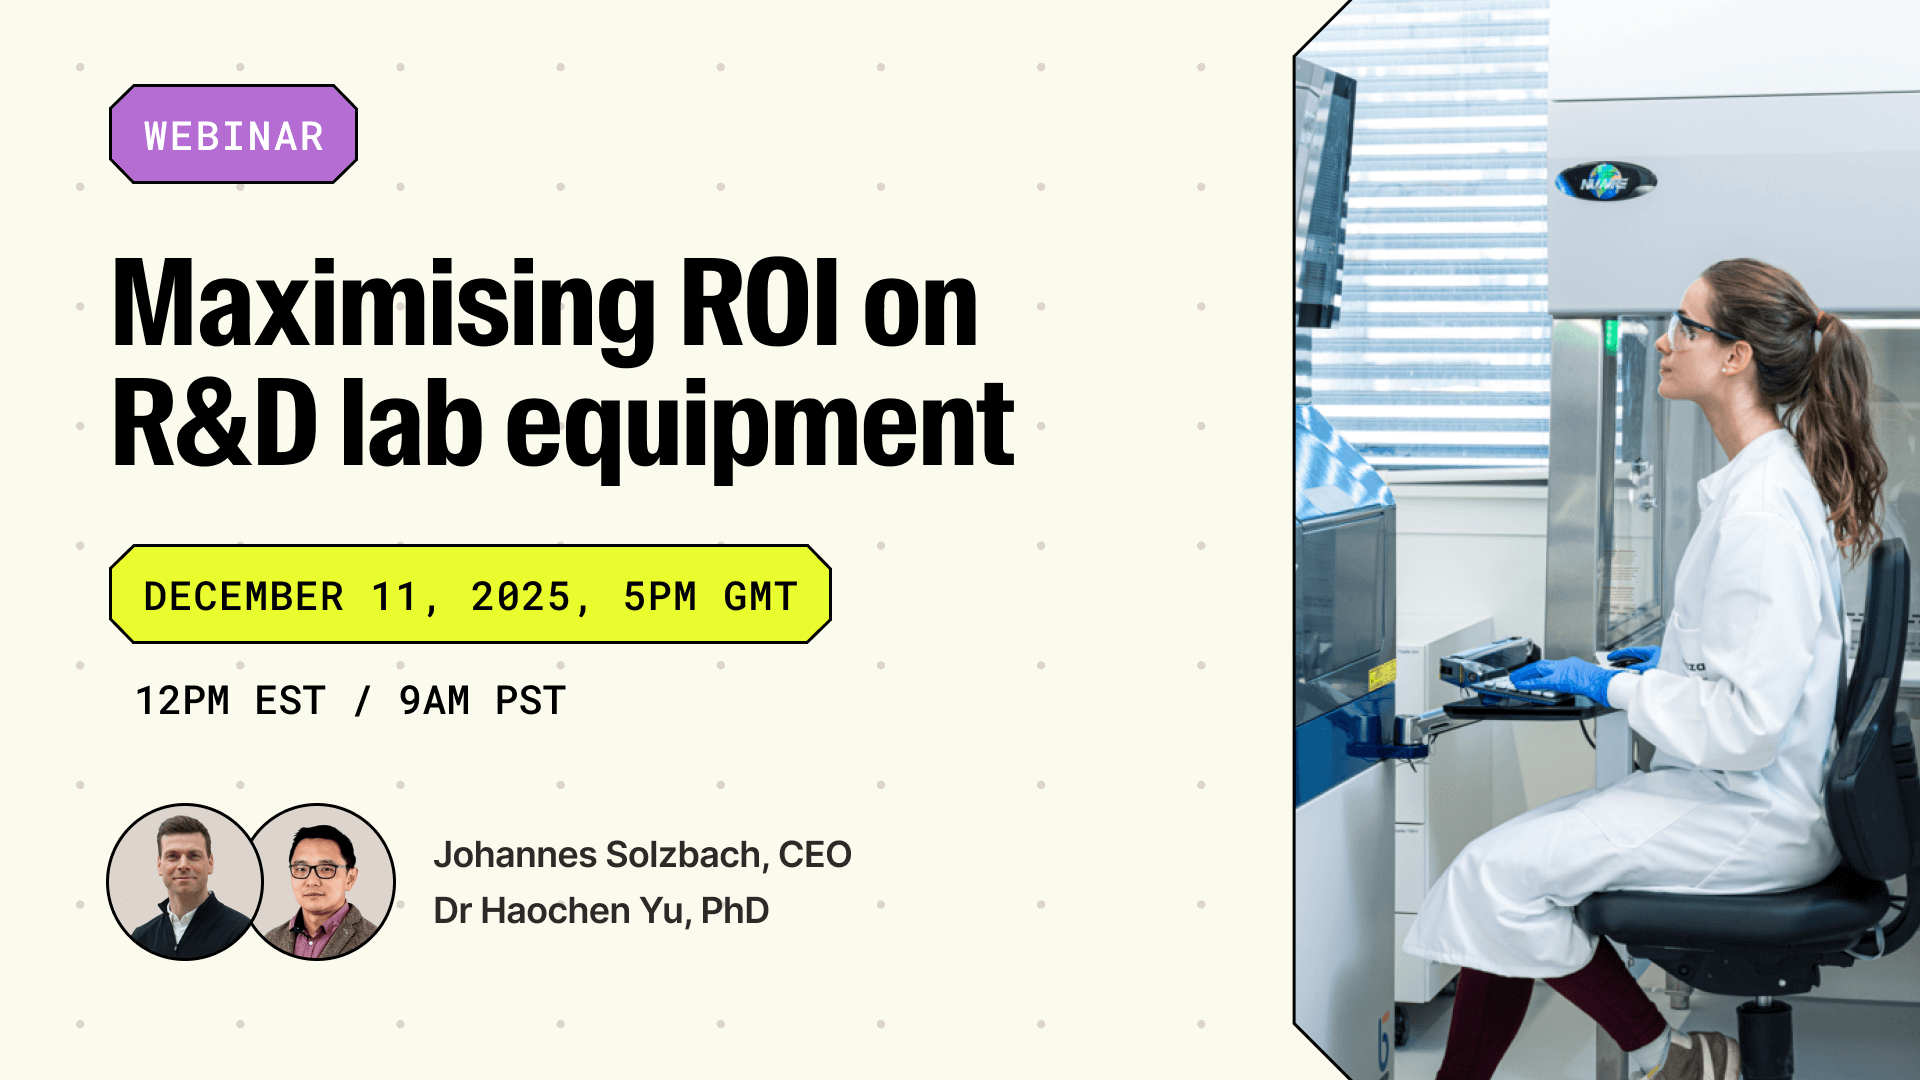


See how busy R&D lab equipment really is, by equipment type, using anonymized scheduling data from the Calira platform. Then compare your own lab against it.

Ask most lab operations teams how their flow cytometers compare with other labs and the honest answer is: no idea. Without a benchmark, it's hard to know whether 20% utilization is a problem, or which instruments to retire, move, share or replace.
In this webinar, we'll share fully anonymized and aggregated equipment utilization data from R&D labs using Calira across the US, UK and Europe, split by equipment category.
You'll see how utilization varies by equipment type, how user numbers affect it and when returns diminish, and how maintenance scales with use. Then we'll look at what three labs did with this data to raise utilization with the instruments they already had.
Everyone who registers gets a PDF of the benchmark data afterwards, whether they attend or not.